Improving Your Website Loading Speeds With Optimization - What You Have To Do
Author: Rob CuppettPosted On: Oct. 04, 2025Last Updated: Oct. 06, 2025
Are you struggling to improve your website's loading speed? You're not alone. It's one of the most common challenges for site owners - and often, the fixes people chase don't address the real issue.
In this post, I'll explain how Ratals CMS, part of our ERP, is built from the ground up to deliver blazing-fast performance. But I'll also show you practical steps you can take to improve speed on your current platform - no matter what it's built on.
Sometimes, the platform itself may be the bottleneck. That's the hardest problem to solve - but by the end of this tutorial, you'll know how to test your site and determine whether your issue is optimization-related or a deeper platform limitation. And if it turns out your current system just can't deliver, Ratals may be the perfect solution - offering not only speed but a complete business management platform.
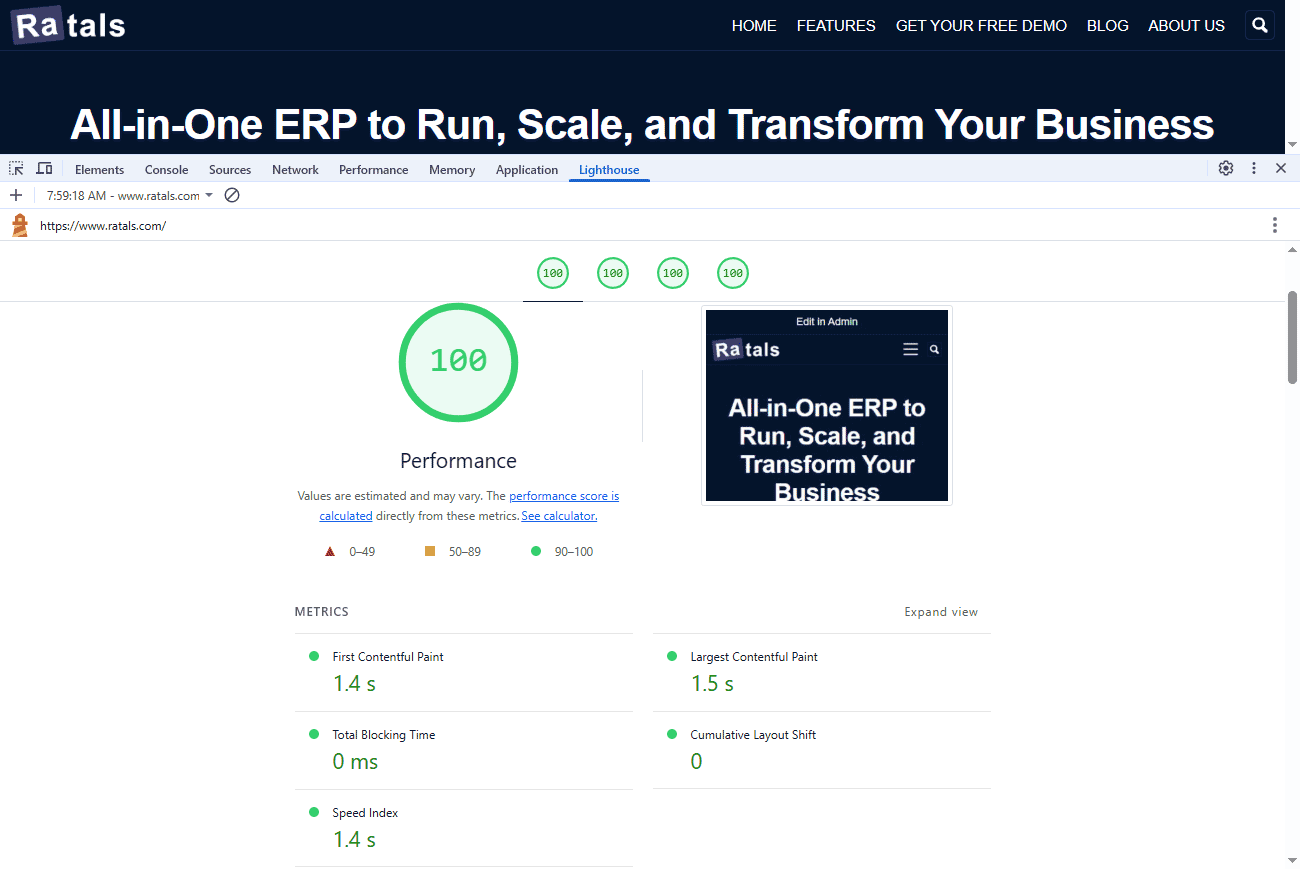
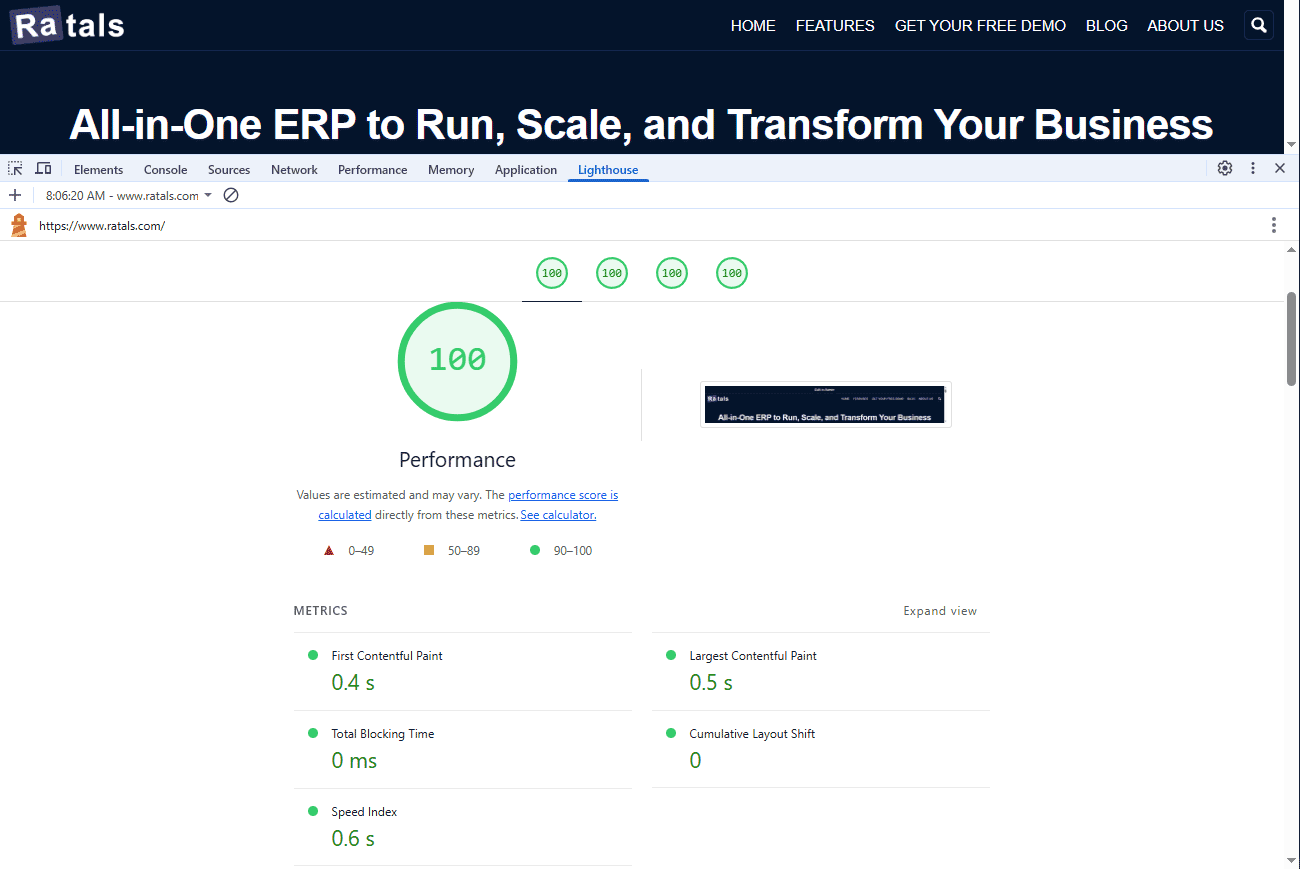
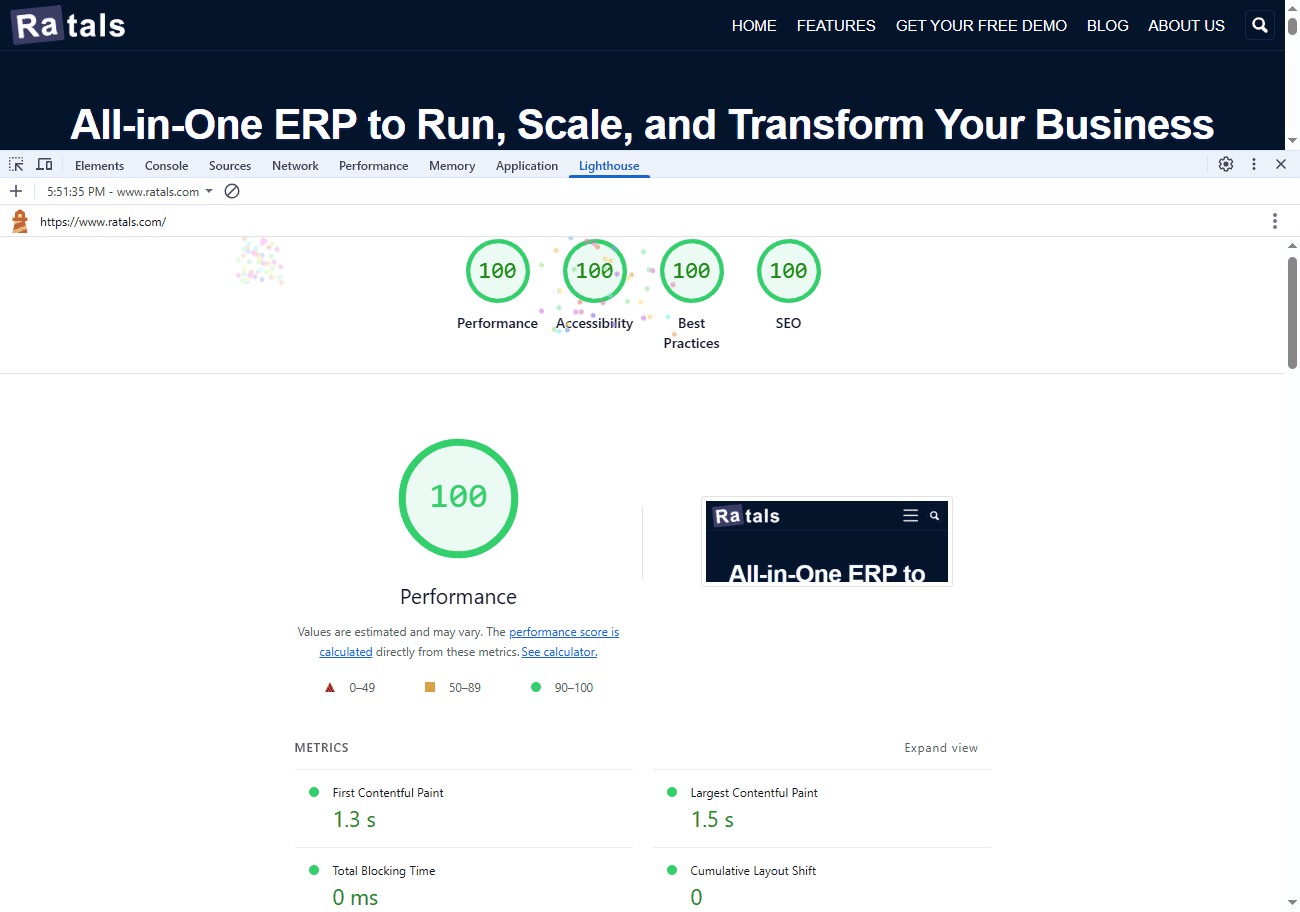
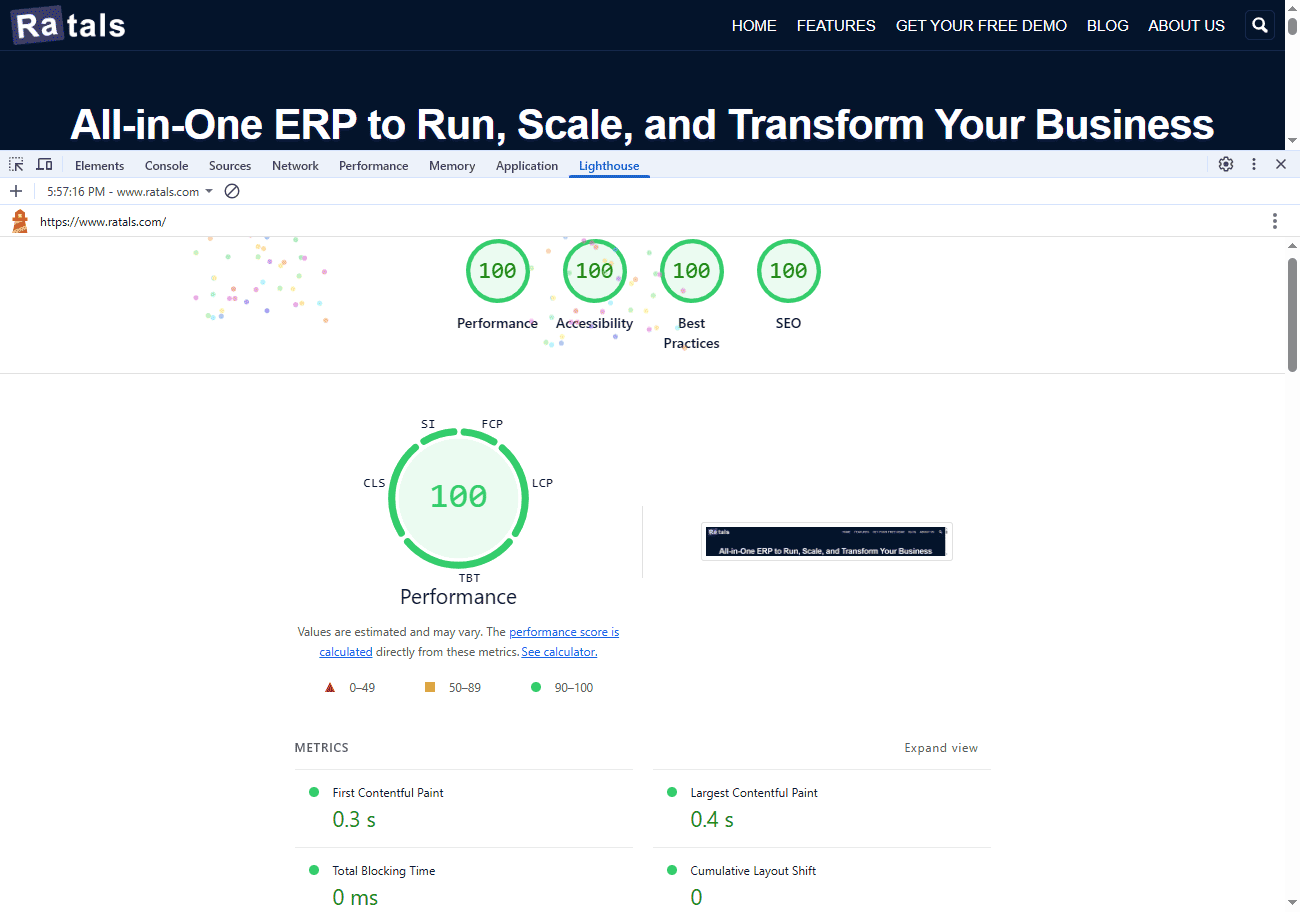
To show you what's possible, let's use Ratals.com as an example. Below is a screenshot showing our homepage scoring a perfect 100% in every category of Google Chrome Lighthouse:
It's important to note - this test was done with server-side caching turned off. Anyone who's ever tried to hit perfect Lighthouse scores knows how difficult that is, especially for a large homepage with over 100 icon images like ours.
These scores represent what every developer and site owner aims for - and with Ratals CMS, achieving them isn't a dream, it's the default.
Step 1: Test If Your Platform Can Perform Like This
To find out whether your site can perform at this level, start by measuring how fast your server-side code executes and how quickly it builds the output - all with server-side caching turned off.
This processing time is known as Time to First Byte (TTFB) - the delay between when your browser sends a request and when the server begins to respond.
Next, let's walk through how to measure TTFB using Google Chrome DevTools.
Step 2: Open Chrome DevTools
Open your website in Google Chrome.
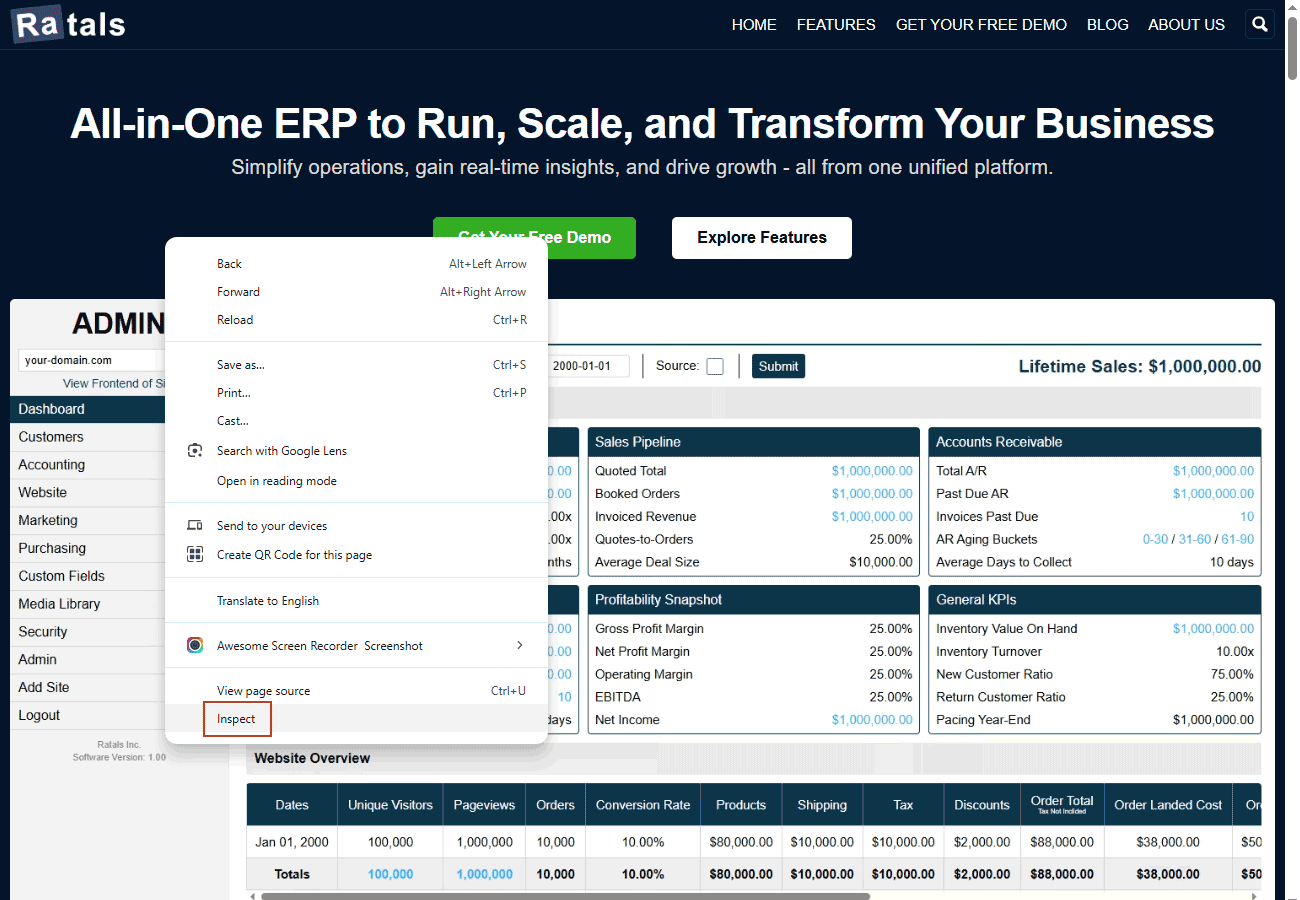
Right-click anywhere on the page and select Inspect:
After clicking Inspect, the DevTools panel will appear - usually docked to the right side of your browser window.
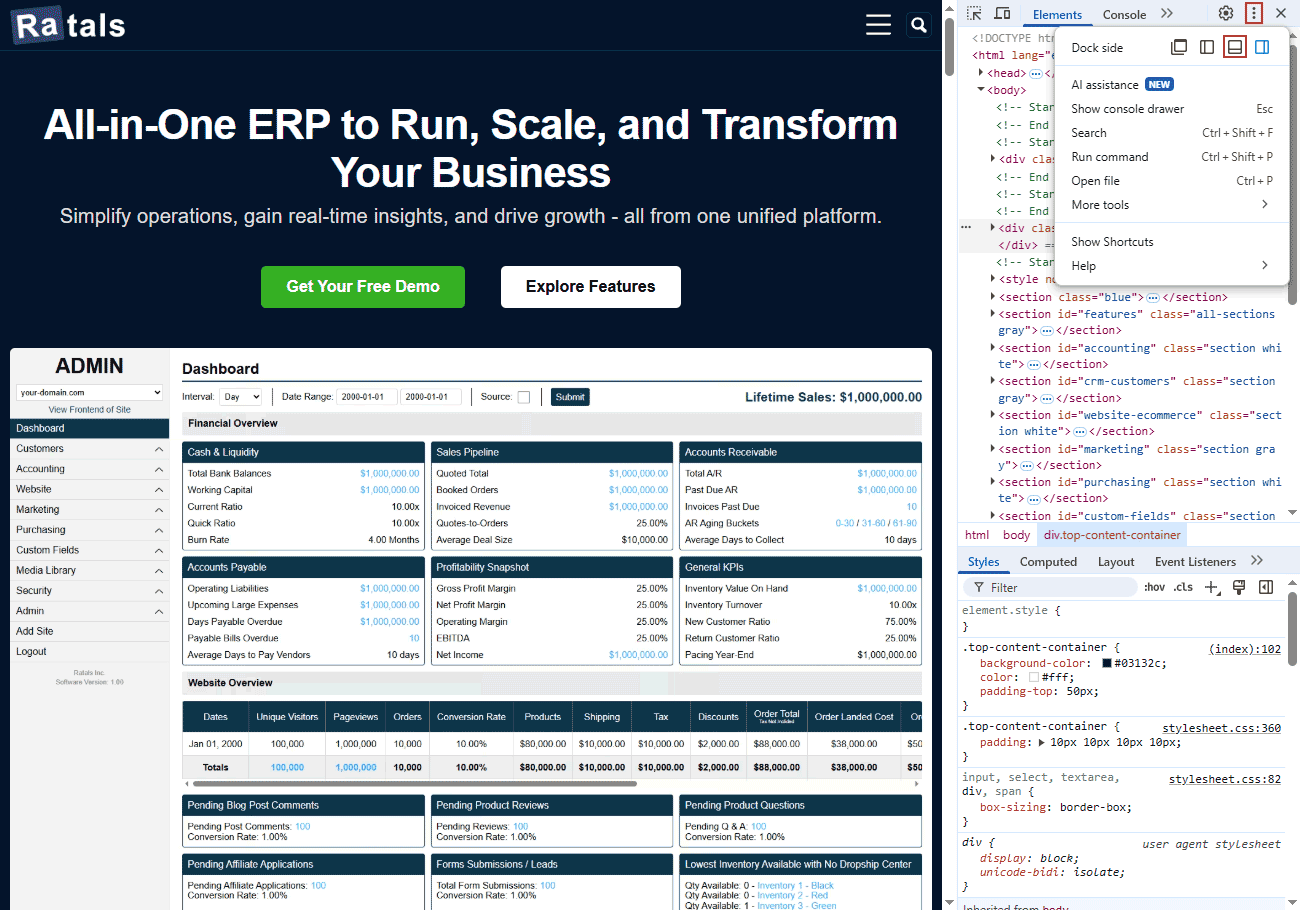
For a clearer view of all the tabs (Elements, Sources, Console, Network, etc.), I recommend docking it to the bottom.
To do this, click the three-dot menu in the top-right corner of DevTools, then choose Dock to bottom:
You should now see your DevTools panel at the bottom of your screen, ready for performance testing.
Step 3: Disable Caching Before You Test
Before running any performance tests, it's critical to disable caching.
Caching stores fully rendered pages so they can be delivered instantly on repeat visits. It's great for managing high traffic, but during testing, it can hide slow backend performance - giving you a false sense of speed.
When someone says "my site feels slow," the common advice from web hosts or SEO consultants is to "just turn on caching." But caching isn't a real fix - it's a temporary band-aid. It masks the underlying problems like inefficient database queries, heavy plugins, or unoptimized code.
To accurately measure how fast your server actually is, caching must be turned off before you test.
It's also important to note that all of our tests and perfect Lighthouse scores on Ratals.com were achieved on a low-cost shared hosting plan, with no caching enabled. This proves you don't need a high-end dedicated server to reach extremely low load times - careful code and a lightweight CMS are far more important than expensive hardware.
Step 4: Measure Your Document Load Time
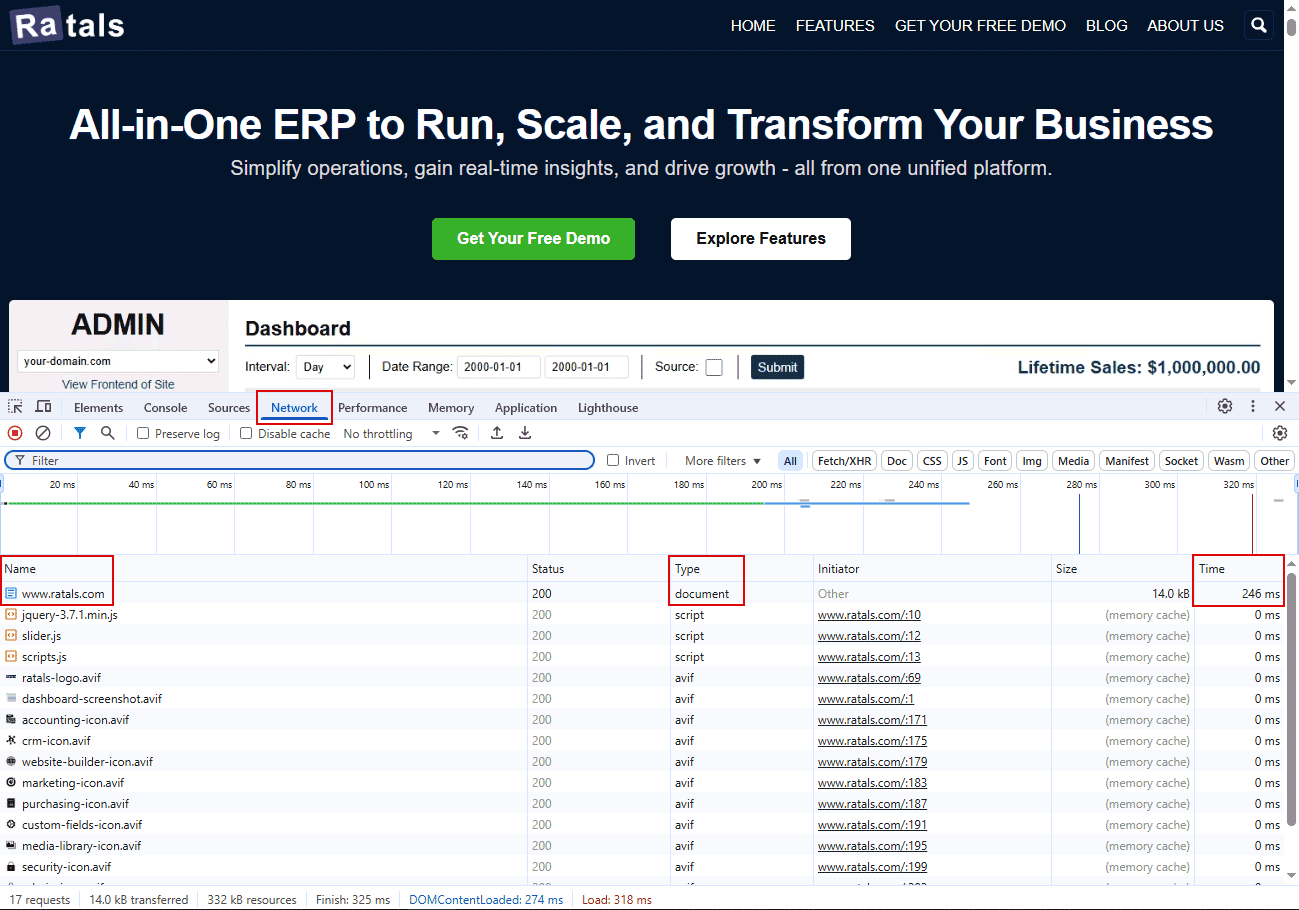
Now that caching is disabled and DevTools is open, navigate to the Network tab. Find the first request - your site's main document - and check its Load Time, like this:
On Ratals.com, our document load time for this test was just 246 milliseconds (ms) - even for a large homepage with over 100 images.
These blazing-fast numbers demonstrate how well-optimized our backend architecture is. Despite handling heavy content, the server responds almost instantly.
If your site's document load time exceeds 300-400 ms for a large page or 100-200 ms for a smaller one, it likely indicates inefficiencies in your CMS or hosting environment. In that case, you may need to review your backend architecture or consider a platform like Ratals, which is engineered to eliminate those bottlenecks.
Note: Even large e-commerce stores should be able to achieve these types of speeds - without any server-side caching.
Step 5: Measure Your First Contentful Paint (FCP)
After confirming strong backend performance by checking Document Load Time, the next key metric is First Contentful Paint (FCP).
What is FCP?
First Contentful Paint measures how quickly the first visible element - text, images, or background color - appears on the screen after a page starts loading. This metric reflects perceived speed, marking the moment users first see something happening on your site.
Even with a lightning-fast backend, a poor FCP makes visitors feel like your site is slow.
How to Test FCP in Google Chrome
Open Chrome DevTools (as shown in Step 2).
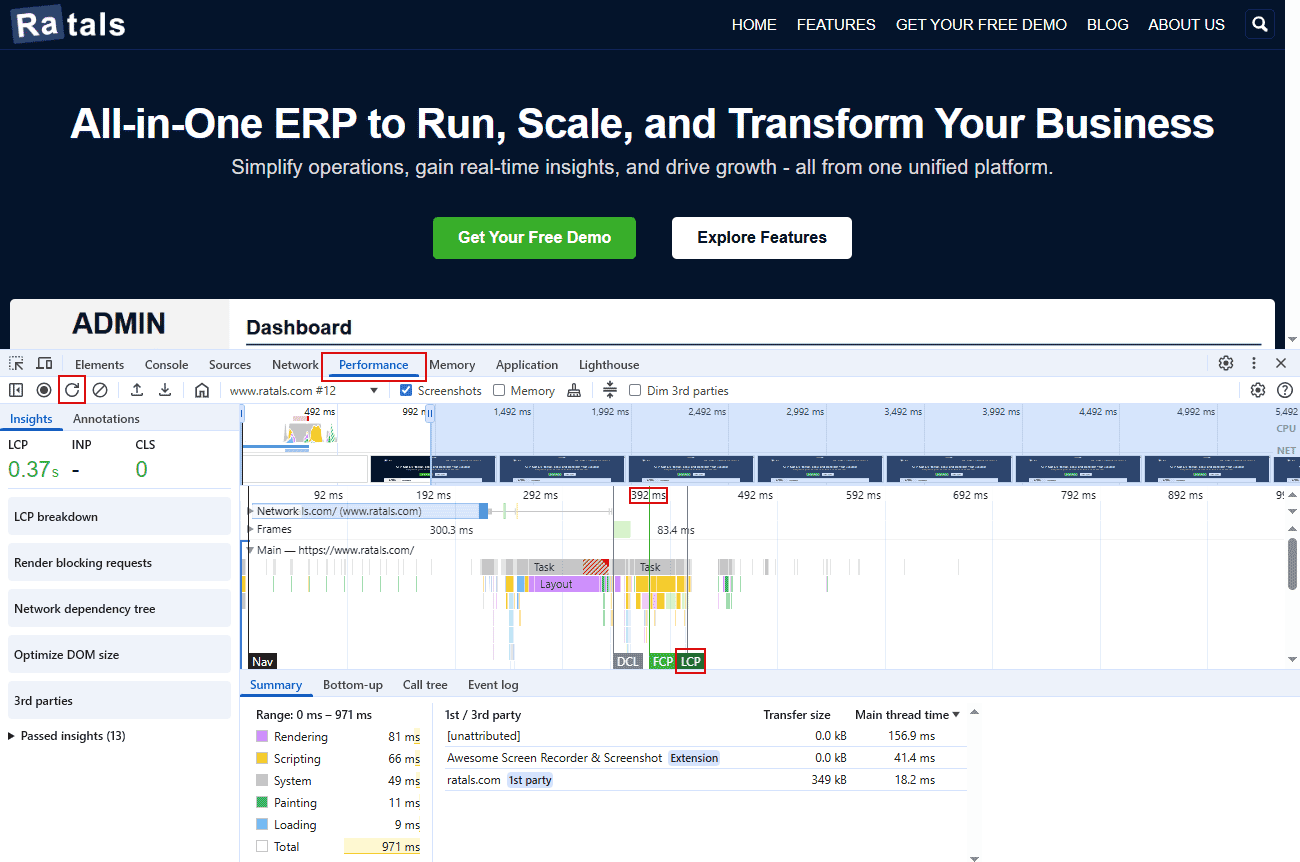
Go to the Performance tab.
Click the Reload button (⟳) inside the Performance panel to start a new recording. Chrome reloads your site and tracks all key performance metrics.
When the recording finishes, examine the timeline graph.
Hover over the timeline to find FCP:
Note: Ratals.com achieved an FCP of 392 ms, which Lighthouse rounds to 0.4 seconds.
How to Interpret FCP Results
Google classifies FCP times as:
FCP Time
Rating
0 - 1.8 seconds
🟢 Excellent
1.8 - 3.0 seconds
🟡 Needs Improvement
Over 3.0 seconds
🔴 Poor
If your FCP exceeds 3 seconds, the browser takes too long to render the first visible content. Common causes include:
Slow backend response (refer to Step 4).
Large or render-blocking CSS and JavaScript files.
Unoptimized hero images or oversized graphics.
Fonts loading too late or blocking text rendering.
Benchmarking with Ratals.com
Ratals.com scored 1.4 seconds on mobile and 0.4 seconds on desktop for FCP, with caching off.
FCP Mobile Results: 1.4 Seconds
FCP Desktop Results: 0.4 Seconds
Mobile tests often show slower times because they simulate weaker devices and slower networks, such as 4G. Even so, these scores fall comfortably within the Excellent category.
Connecting FCP to Document Load Time
If your document load time is slow, FCP cannot be excellent - the browser waits for the server's response before rendering content.
If your backend is fast but FCP is slow, front-end assets are likely too heavy. Focus on minimizing render-blocking CSS, JavaScript, and oversized images.
How Ratals CMS Handles FCP
Ratals CMS is engineered so visible content begins rendering almost instantly. We defer non-critical scripts, preload essential resources, and optimize image delivery at the CMS core - all without caching.
This ensures pages feel fast to users, not just in metrics but in real-world browsing.
Quick Tip: Check FCP in Lighthouse
For a simpler overview, use the Chrome Lighthouse tab. Run a test, and you'll see FCP clearly listed at the top of the report. Lighthouse rounds the number to seconds (e.g., 0.4 s), making it easier to read. You only need the Performance tab for deep troubleshooting.
In short:
FCP measures when visitors first see content. Slow FCP makes your site feel sluggish, even with a fast backend. Optimize render-blocking scripts, compress images, and streamline CSS to achieve excellent FCP times - or consider Ratals CMS, which handles this automatically.
Step 6: Measure Your Largest Contentful Paint (LCP)
After evaluating First Contentful Paint (FCP), the next major performance milestone is Largest Contentful Paint (LCP).
What is LCP?
Largest Contentful Paint measures how long it takes for the largest visible element in the viewport - typically a hero image, headline, or featured banner - to fully render.
Note: A hero image is a large banner-style image visible in the initial viewport. It showcases your main offer, product, or message - essentially acting as the "hero" of the page.
While FCP shows when something first appears, LCP shows when the most important content finishes loading. This metric directly affects perceived site readiness. Even if smaller elements appear quickly, users will perceive the page as slow if the hero section takes too long.
How to Test LCP in Google Chrome
Open Chrome DevTools.
Go to the Performance tab.
Click the Reload button (⟳) to record a new performance trace.
After recording, hover over the timeline to find Largest Contentful Paint, marked by a vertical line labeled LCP.
Note the timestamp in milliseconds.
You can also view your LCP via a Lighthouse test. It will appear in the Performance summary, just like FCP.
Interpreting LCP Results
Google classifies LCP performance as:
LCP Time
Rating
0 - 2.5 seconds
🟢 Excellent
2.5 - 4.0 seconds
🟡 Needs Improvement
Over 4.0 seconds
🔴 Poor
High LCP means your main content takes too long to render, even if smaller elements load quickly.
Common Causes of Slow LCP
Large hero/banner images not optimized for web delivery
Render-blocking CSS or JavaScript delaying layout painting
Slow server response for above-the-fold content
Misconfigured lazy loading for critical images
In Ratals, you can control lazy loading per image and set fetchpriority="high" for critical elements, telling the browser to load them immediately.
Benchmarking with Ratals.com
Lighthouse tests for Ratals.com show:
Mobile: 1.5 seconds
Desktop: 0.5 seconds
Tests conducted with caching disabled
LCP Mobile Results: 1.5 Seconds
LCP Desktop Results: 0.5 Seconds
These scores are well within Google's Excellent range (0-2.5 seconds), demonstrating that Ratals CMS optimizes both backend and front-end performance.
If Document Load Time (Step 4) or FCP (Step 5) were slow, your LCP will likely be slow too, since those earlier processes must complete before the largest element can render.
How Ratals CMS Optimizes LCP
Ratals CMS automatically optimizes LCP with:
Responsive scaling and next-gen image formats (AVIF, WebP)
Multiple size variations delivered via with attributes
Automatic prioritization of critical images (fetchpriority="high")
This ensures your largest content loads instantly, critical for achieving perfect Lighthouse scores.
In Short
LCP shows when your main content finishes loading - the moment the page feels complete.
Optimizing both backend (TTFB, Document Load) and front-end (FCP, LCP) ensures a seamless, instant-feeling experience.
Ratals.com proves that achieving Excellent scores across all metrics is possible, even without caching.
Step 7: Measure Your Total Blocking Time (TBT)
After checking Largest Contentful Paint (LCP), the next key metric is Total Blocking Time (TBT) - the amount of time your page spends stuck running JavaScript before it can respond to user interactions.
What is TBT?
Total Blocking Time measures how long the main thread is blocked by long-running JavaScript tasks between First Contentful Paint (FCP) and Time to Interactive (TTI). Even if your page appears loaded, a high TBT can cause lag and unresponsiveness for users.
How to Test TBT in Google Chrome
Open Chrome DevTools.
Go to the Lighthouse tab.
Choose Mobile or Desktop.
Run the test.
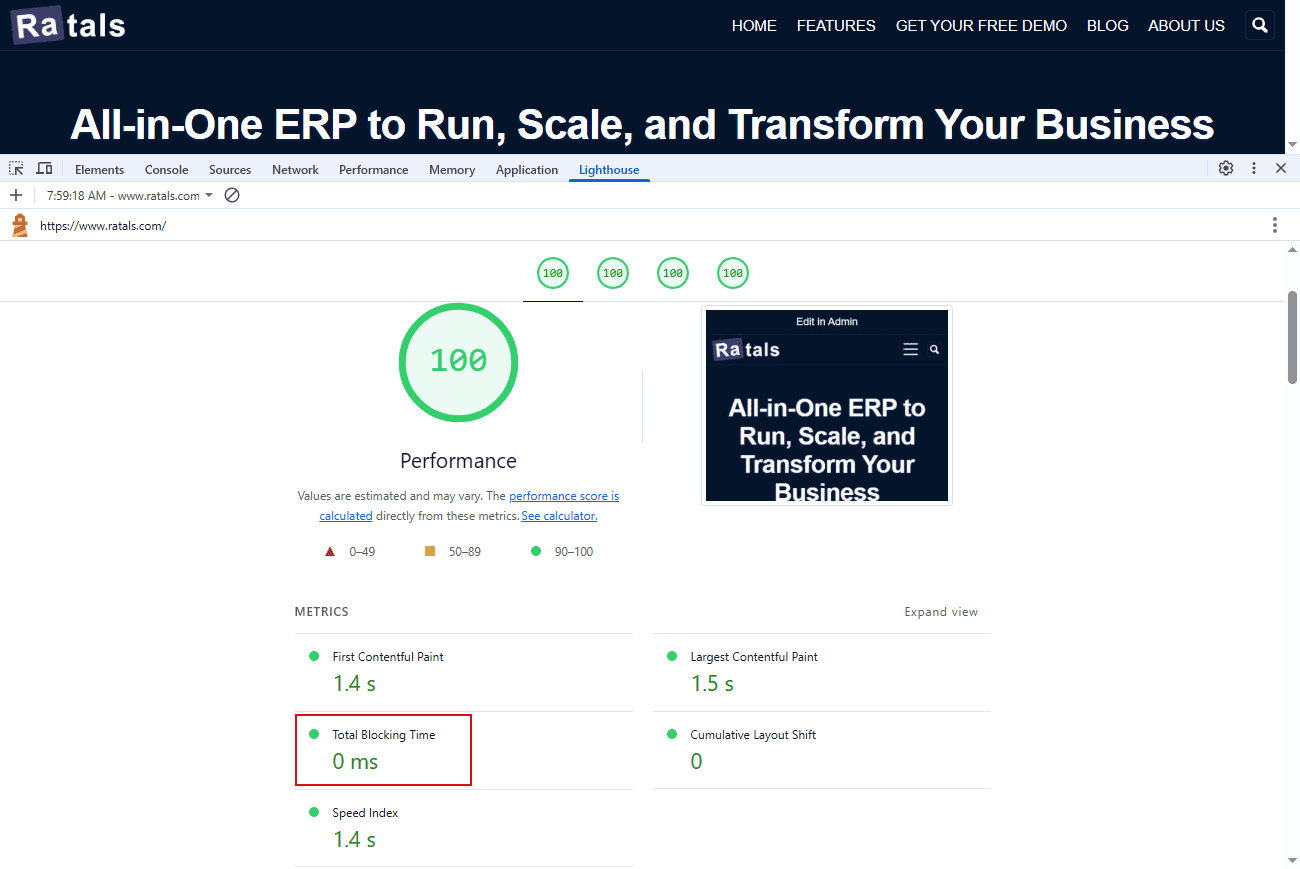
In the report, check Total Blocking Time under the Performance section.
Interpreting TBT Results
Google classifies TBT as:
TBT Duration
Rating
0 - 200 ms
🟢 Excellent
200 - 600 ms
🟡 Needs Improvement
Over 600 ms
🔴 Poor
Low TBT indicates efficient, non-blocking JavaScript. High TBT often means heavy scripts or large bundles are monopolizing the main thread, delaying user interactions.
Common Causes of High TBT
Large or unoptimized JavaScript bundles (e.g., loading jQuery unnecessarily)
Third-party scripts (tracking pixels, chat widgets, analytics) running too early
Excessive DOM manipulation or layout reflows
Long-running functions that block the event loop
Benchmarking with Ratals.com
Lighthouse testing of the Ratals.com homepage shows:
0 ms on Mobile
0 ms on Desktop
Tests conducted with caching disabled
TBT Mobile Results: 0 ms
TBT Desktop Results: 0 ms
This means the browser is never blocked and can respond instantly throughout the page load.
How Ratals CMS Keeps TBT at 0 ms
Ratals CMS is built for zero blocking time by design. Key techniques include:
Deferred and asynchronous JavaScript loading - non-critical scripts load after visual content is ready.
Code splitting and lazy execution - only essential scripts for visible components load immediately. jQuery is loaded by default when necessary.
Minimal main-thread work - heavy calculations and animations are handled via CSS or throttled.
Secure script handling with nonces - inline CSS is avoided due to Level 4 XSS protection, but optimization ensures zero impact on speed.
Occasionally, a performance score may show 98 or 99 instead of 100 due to slower devices, network speed, or browser extensions - not the site itself.
In Short
TBT measures how long your page is blocked by code and unable to respond to users.
High TBT means your site feels slow or unresponsive, even if content appears loaded.
Optimizing JavaScript size, execution order, and timing is essential for reducing TBT.
With Ratals CMS, 0 ms Total Blocking Time is the standard, not a rare achievement, thanks to its lightweight runtime architecture.
Step 8: Measure Your Cumulative Layout Shift (CLS)
After optimizing Total Blocking Time (TBT), the final Core Web Vital to check is Cumulative Layout Shift (CLS) - a metric that tracks how visually stable your page is during loading.
What is CLS?
CLS measures how much elements unexpectedly move while your page loads. A "layout shift" occurs when visible content - like text, buttons, or images - moves from its initial position after rendering.
For example: if a user tries to click a button, but it jumps down because something above it loads late, that's a layout shift.
Even with fast load times, high CLS can frustrate users, make your site feel unpolished, and cause misclicks.
How to Test CLS in Google Chrome
Open Chrome DevTools.
Go to the Lighthouse tab.
Select Mobile or Desktop.
Click Analyze page load (or "Generate report").
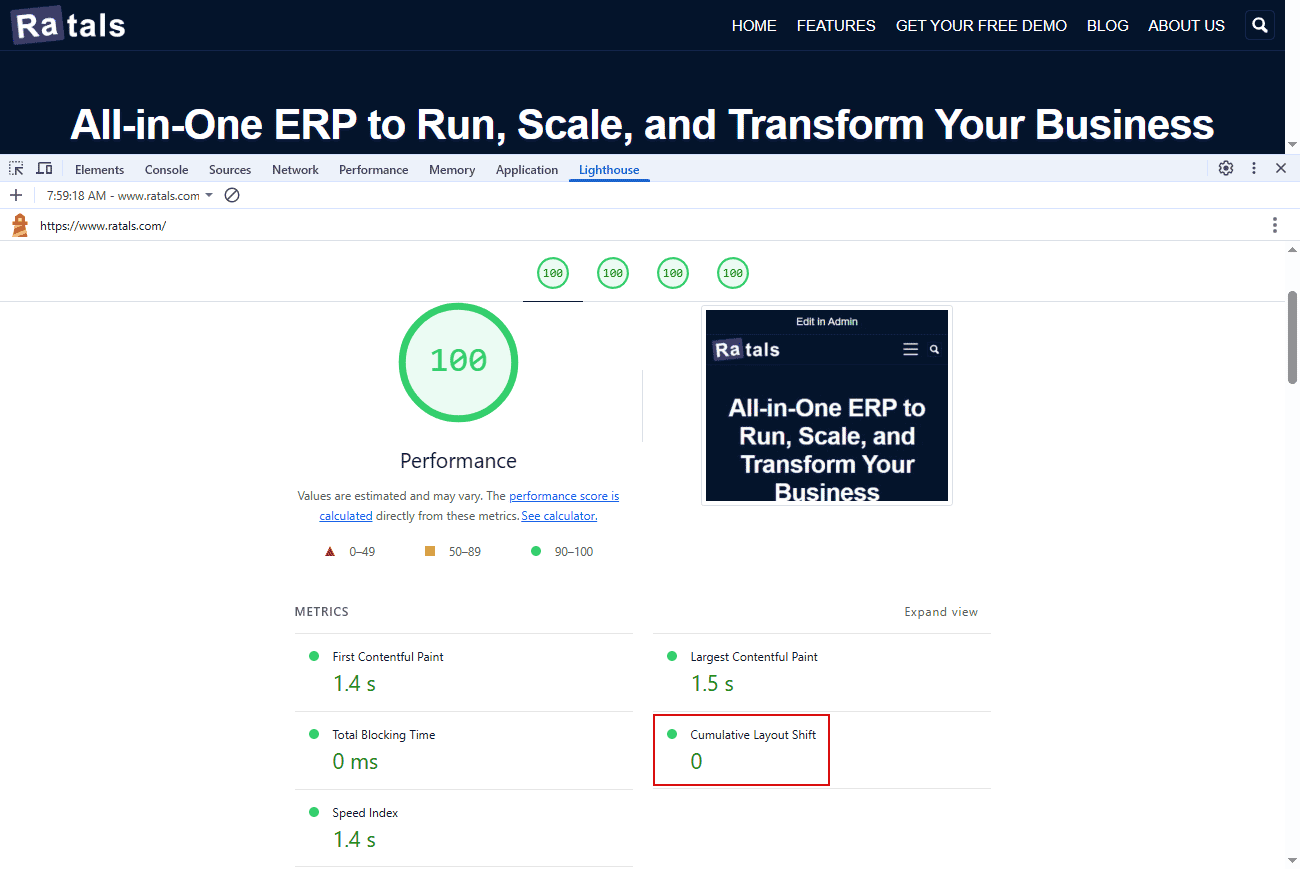
In the results, scroll to Performance to see your CLS score.
Interpreting CLS Results
CLS Score
Rating
0 - 0.1
🟢 Excellent
0.1 - 0.25
🟡 Needs Improvement
Over 0.25
🔴 Poor
A perfect CLS of 0.00 means no elements shift unexpectedly.
Common Causes of Poor CLS
Images or ads without fixed dimensions - the browser cannot reserve space before loading.
Fonts loading late - causing text to reflow or resize.
Dynamically injected content - banners, cookie notices, or pop-ups pushed into view after render.
Late-loading components - carousels, videos, or animations expanding after the page loads.
Benchmarking with Ratals.com
Ratals.com Lighthouse results:
0.0 ms on Mobile
0.0 ms on Desktop
Tests conducted with caching disabled
CLS Mobile Results: 0.0 ms
CLS Desktop Results: 0.0 ms
Ratals pages never shift during loading - every image, icon, and text block remains perfectly stable, even with over 100 SVG and image icons on the homepage.
How Ratals CMS Achieves Perfect CLS
Predefined image dimensions: Width and height attributes ensure space is reserved before images load.
Font preloading: Uses browser-safe fonts by default to avoid text reflows.
No injected banners above-the-fold: All viewport content is static on first render.
Deferred third-party content: Analytics or chat widgets load after layout stabilizes.
In Short
CLS measures visual stability during page load. High CLS hurts usability and perceived quality.
To fix CLS, focus on:
Explicit sizes for all media.
Browser-preloaded fonts - doesn't always work reliably; it's usually best to stick with default browser-loaded fonts.
Ratals CMS handles all of this automatically, keeping Cumulative Layout Shift at 0.0 ms - your content appears fast, smooth, and stable.
Turning Caching Back On - What Really Happens
After testing all Core Web Vitals with caching turned off and addressing any issues, the final step is to turn caching back on and compare performance.
Key insight: in Ratals CMS, performance numbers hardly change.
This highlights an important principle: caching is not a speed tool. If your backend and front-end are optimized, caching mainly supports scalability under heavy traffic, allowing your site to handle more users without additional server resources.
If your site only performs well with caching enabled, that's a red flag - your infrastructure isn't optimized.
If your site performs excellently without caching, then caching is simply a scalability aid, not a crutch.
Note: Ratals has a built-in caching system. Many caching solutions cache entire pages, breaking dynamic content like personalized cart items. Ratals avoids this, maintaining both speed and dynamic functionality.
Important: Document Load Time should improve slightly with caching, since the server skips some processing steps. Other Core Web Vitals (FCP, LCP, TBT, CLS) should remain largely unchanged. The real test is whether your backend starts slowing down when caching is off.
Mobile vs. Desktop Performance Comparison
Mobile Test
Metric
Caching Off
Caching On
Document Load Time
246 ms
88 ms
First Contentful Paint (FCP)
1.4 s
1.3 s
Largest Contentful Paint (LCP)
1.5 s
1.5 s
Total Blocking Time (TBT)
0 ms
0 ms
Cumulative Layout Shift (CLS)
0 ms
0 ms
Desktop Test
Metric
Caching Off
Caching On
Document Load Time
246 ms
88 ms
First Contentful Paint (FCP)
0.4 s
0.3 s
Largest Contentful Paint (LCP)
0.5 s
0.4 s
Total Blocking Time (TBT)
0 ms
0 ms
Cumulative Layout Shift (CLS)
0 ms
0 ms
Minimal differences with caching demonstrate that Ratals is architecturally solid. Every query, PHP render, and asset delivery is already optimized. Caching primarily ensures high traffic efficiency, not artificially inflated speed scores.
This proves that Ratals is not just fast in ideal conditions - it's engineered for real-world performance, with or without caching.
Conclusion - Why the Order of Steps Matters
As you've seen, the order of optimizations is critical. If earlier steps - such as server response time, Document Load Time, or First Contentful Paint - aren't performing well, achieving excellent results in later metrics like LCP, TBT, or CLS becomes much harder. Each Core Web Vital builds on the previous one, so following the right sequence ensures that improvements compound effectively.
It all begins at the server and backend level. The efficiency of your code in constructing responses directly affects every metric your users experience. Whether your backend is built with PHP, ASP, Node.js, Python, or another popular language, slow database queries, inefficient loops, or poorly structured responses can bottleneck the page load - no matter how optimized your front-end assets are.
This is just one of hundreds of features that make Ratals CMS and ERP stand out. From intelligent backend processing to responsive image delivery, automatic script deferral, and zero-blocking-time architecture, Ratals is engineered to deliver consistently excellent performance at every stage.
To explore all the capabilities that make Ratals unique, check out our Admin Features page - you'll see how much more Ratals can do beyond a fast website.
If you're ready to achieve these kinds of performance numbers for your own site, the best next step is to Request a Free Demo. Our team will guide you through the platform, show real-world results, and demonstrate why Ratals truly stands apart from the competition.
Frequently Asked Questions
Why is my website loading slowly even after enabling caching?
Caching only masks slow backend performance. It doesn't fix inefficient database queries or poorly optimized code. To truly improve speed, measure Time to First Byte (TTFB) and optimize your backend logic.
What is a good website loading speed?
Ideally, your site should load in under 2.5 seconds on mobile and under 1.5 seconds on desktop. Google considers a Largest Contentful Paint (LCP) under 2.5 seconds as excellent.
Does website speed affect SEO rankings?
Yes. Google uses Core Web Vitals such as LCP, FCP, and CLS as ranking factors. Faster pages tend to rank higher and improve user engagement and conversions.
Can Ratals CMS help me improve website speed?
Yes. Ratals CMS is engineered for both backend and frontend performance, delivering perfect Lighthouse scores even with caching turned off.
How can I test my website speed accurately?
Use Google Chrome DevTools or Lighthouse to measure metrics like TTFB, FCP, LCP, TBT, and CLS for an accurate performance snapshot.
Rob Cuppett is the founder and lead engineer behind Ratals, bringing over 20 years of experience in digital marketing, software development, and business automation. He shares expert tutorials, practical guides, and insights to help business owners optimize, customize, and fully leverage software solutions to grow their businesses efficiently.
About Ratals
Rob Cuppett is the visionary founder and lead engineer behind Ratals Inc., the groundbreaking software platform designed to revolutionize how businesses operate.
Rob's journey into the digital world began in 2001, during a time when resources on starting...